


Debugging GitHub Actions workflows effectively 🚀
Debug and troubleshoot your failing GitHub Actions workflows easily and effectively using some new tools & tricks!


While I was working on re-engineering the CI/CD pipelines for SciPy last year, I got an opportunity to work with GitHub Actions. GitHub Actions is GitHub’s in-house CI/CD service that has hopefully managed to convince a lot of project maintainers and developers to shift from external CI/CD services (like TravisCI) to GitHub Actions in the hope of a central service that can build, test and deploy.
However, unlike other CI/CD services (like CircleCI), which feature a proper debug mechanism using a CLI and SSH mechanism, GitHub Actions, unfortunately, does not offer any debug tool to make sense of failing workflows. It often leads developers to commit multiple times, to trigger and re-trigger the CI/CD workflows to ensure a green tick beside their commit. The requirement for effective debugging GitHub Actions workflows got me into a rabbit hole.

The best part about using GitHub Actions is the availability of the GitHub API, which we can use from our workflows themselves. GitHub Actions also features a vibrant marketplace with applications centered around making the usage of GitHub Actions more straightforward for developers. It made more sense that someone must have already figured this out, and I found not one or two but multiple solutions altogether!
In this blog, we will explore a few ways through which you can debug your GitHub Actions workflows effectively. Some of these ways have been battle-tested (while debugging workflows for many projects), while some are new for me to try out and get started with!
Creating a GitHub Actions workflow
I would be using a simple Flask application with a single API endpoint that returns a Hello World message to get started. I have also added a test for it to ensure we can install all the dependencies and run the tests on a CI pipeline along with some linting using Flake8. The most basic workflow for testing our application is similar to the following:
# Path: .github/workflows/ci.yml

name: Flask CI

on:
  push:
    branches:
      - master
  pull_request:
    branches:
      - master

jobs:
  build:
    runs-on: ubuntu-latest

    steps:

      - uses: actions/checkout@v2

      - name: Setup Python 3.8
        uses: actions/setup-python@v2
        with:
          python-version: 3.8

      - name: Install dependencies
        run: |
          python -m pip install --upgrade pip
          pip install -r requirements.txt

      - name: Run tests
        run: |
          python -m pytest

      - name: Run Flake8
        run: |
          pip install flake8
          flake8 .
Workflows are written in YAML, which is then committed as part of the repository inside the project's .github/workflows directory. As soon as the code gets pushed, GitHub will detect the workflows that need to be triggered and processed as per the instructions they contain.
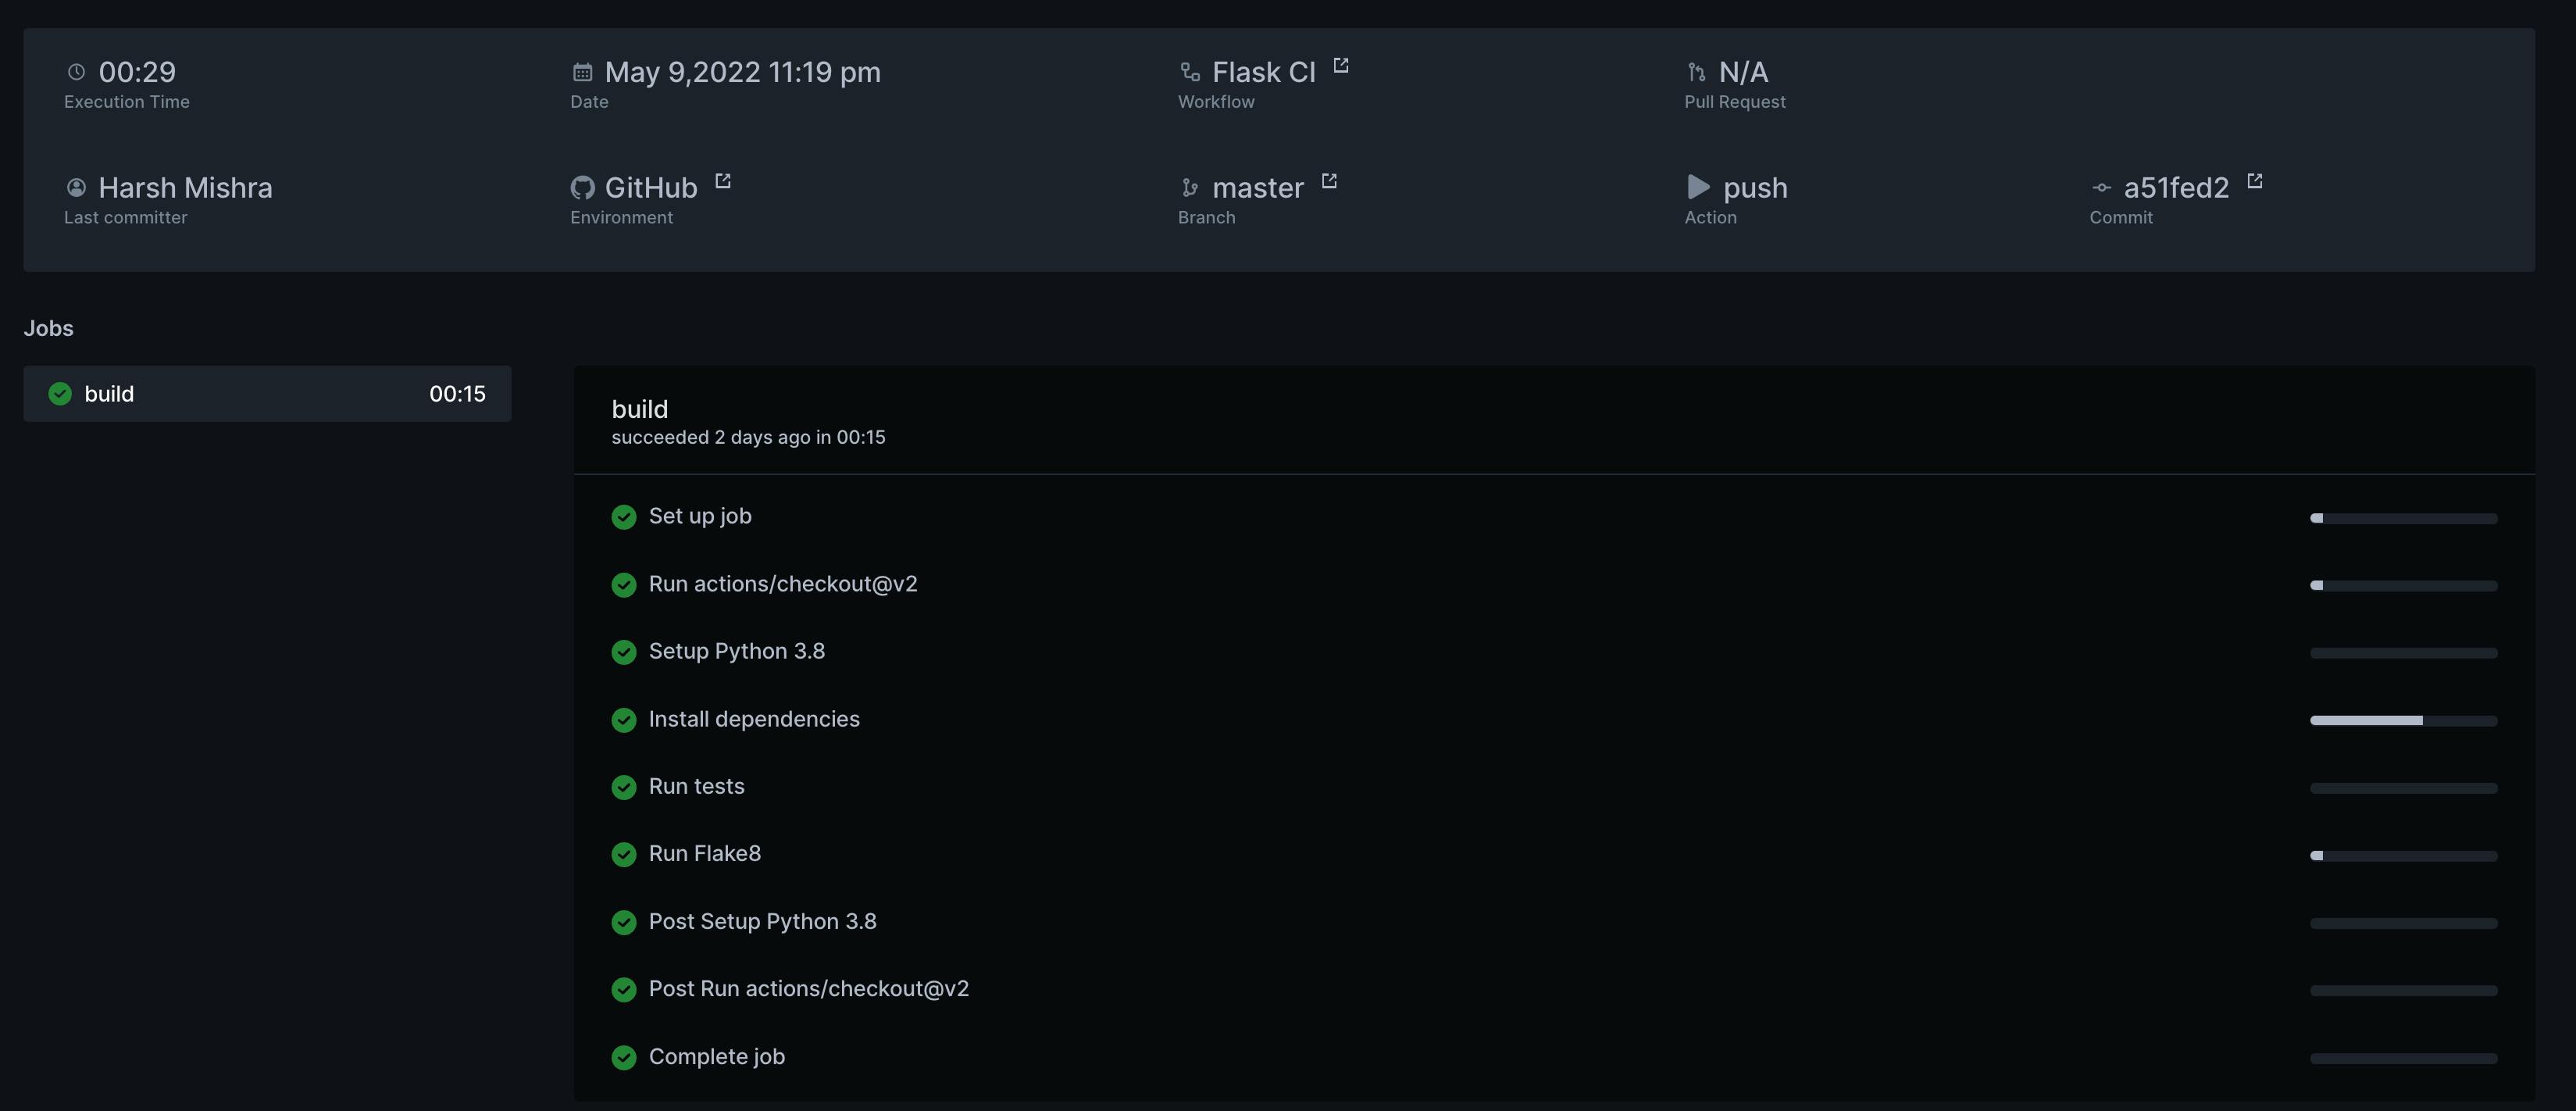
The above workflow spins up a workflow that will get triggered with every push and pull request and check out the code on an Ubuntu runner. It will further install the dependencies, run the tests, and lint the codebase to ensure that the style checks are in place. Now that we have a basic workflow setup, this is how it looks once pushed:
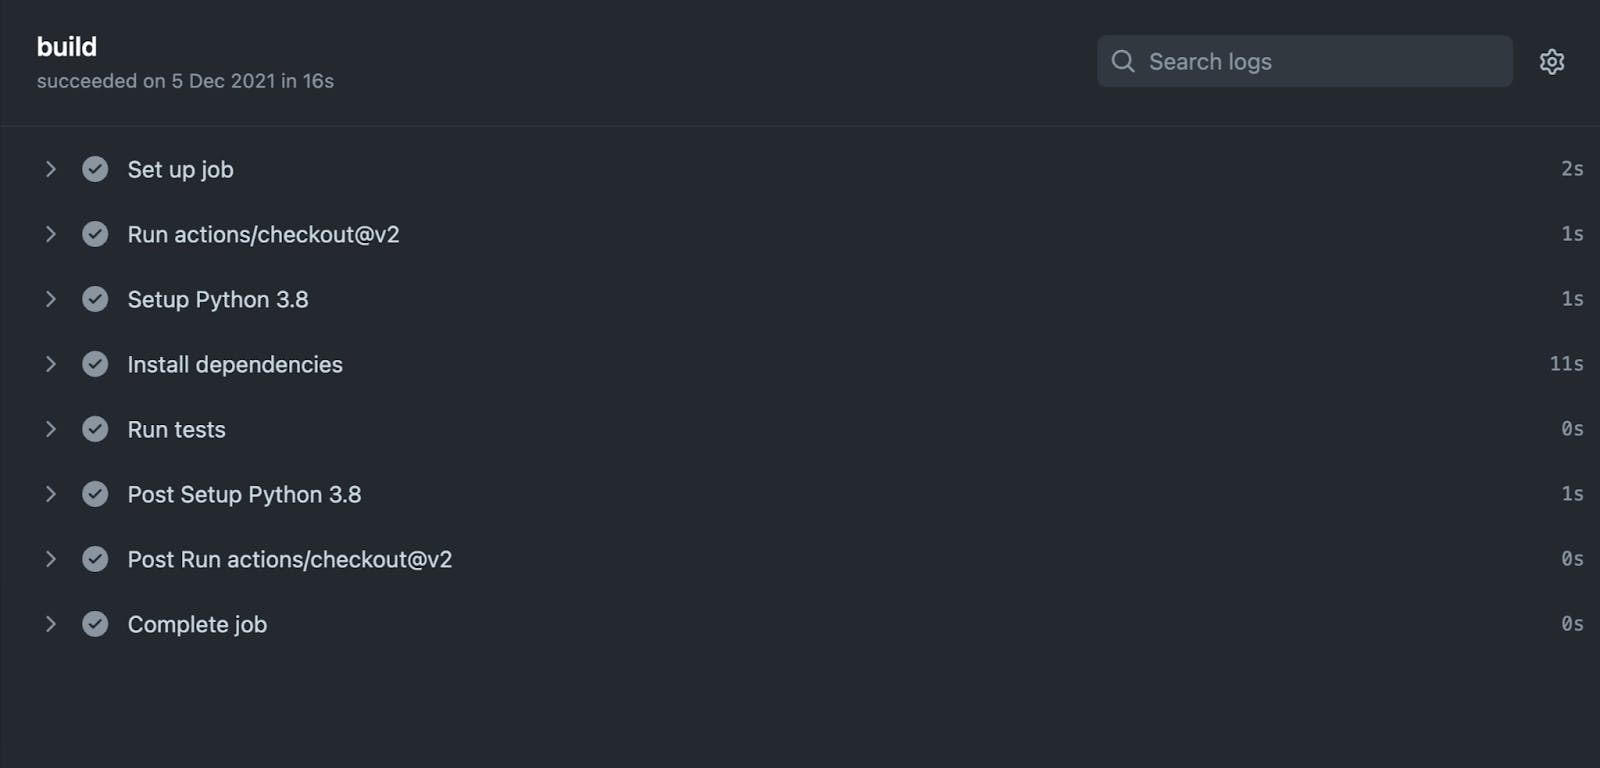
Let’s check how we can further drill into these workflows.
Running workflows locally using act
act is a tool offered by Nektos which provides a handy way to run GitHub Actions locally. It gives a quick way to validate your changes on the CI locally, without committing/pushing your changes to the workflows to trigger and validate them. It leads to fast feedback and compatibility as a local task runner to validate all our CI jobs.
Internally, act works by emulating the workflows that we want to run by building up and running a Docker container where your jobs are executed. act pulls the marketplace actions as separate Docker images and allows us to use them inside the Docker container in an elegant fashion. While the internal implementation is complex, act gives you a neat manner to run GitHub Actions workflows locally with just a single command!
act can be set up locally with Homebrew, Chocolatey, or even a simple BASH script. To set it up using the BASH script, push the following command on your terminal:
curl https://raw.githubusercontent.com/nektos/act/master/install.sh | sudo bash
If you have Homebrew available, install it using:
brew install act
The next step is to define the custom image that we can use to run the workflow locally. act provides a micro, medium, and larger Docker image for Ubuntu GitHub runner. However, act does not support Windows and macOS images yet. While running act for the first time, we can define the image we would like to utilize for our local CI runs. The configuration is saved inside the ~/.actrc file. You can optionally pull the image straight from the GitHub Container Registry:
docker pull ghcr.io/catthehacker/ubuntu:act-latest
In a GitHub repository, while running act for the first time, it will find the ./.github/workflows and all the workflows present. To checkout the jobs listed as part of the GitHub Actions CI, push the following command:
act -l
It returns the following:
$ act -l

Stage  Job ID  Job name  Workflow name  Workflow file  Events
0      build   build     Flask CI       ci.yml         push,pull_request
You can now run the workflow by specifying act or if there are multiple workflows, you can invoke a single one by specifying act -j <job_name>:
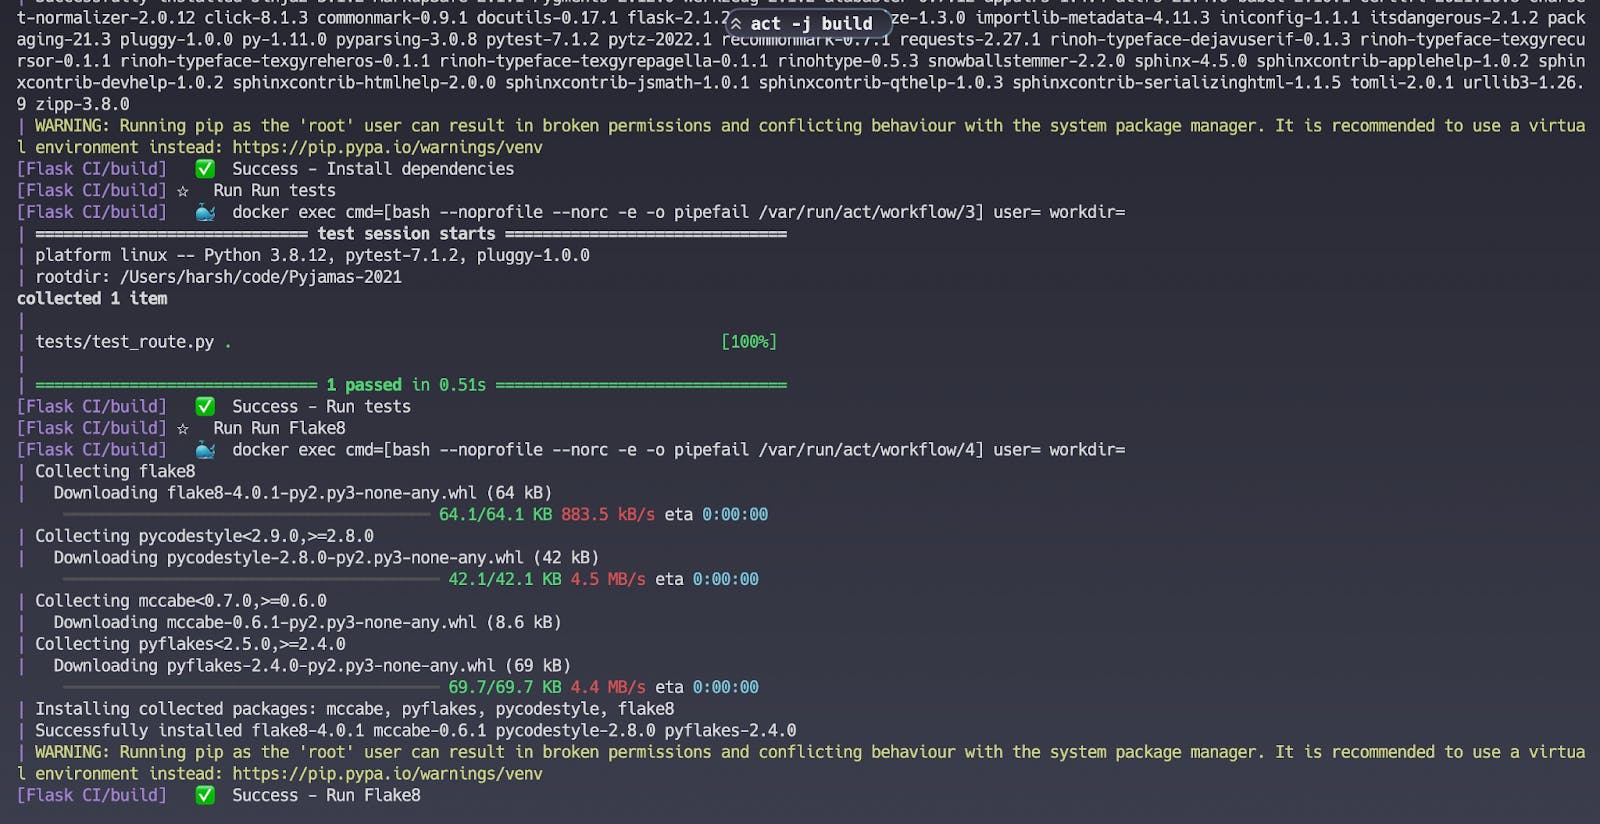
act -j build
On a successful completion of the workflow you will see a ✅ Success signifying that the workflow has been successfully executed!
But what in case of a workflow run failure? In that case, it is preferred to add a verbose option using the -v, --verbose flag to get as much information as you can about the workflow run that occurs while act runs.
You can also get shell access using the below command since act is effectively a local reproduction of a GitHub Action workflow, albeit inside a Docker container:
docker run -it -v $(pwd):/app/ ghcr.io/catthehacker/ubuntu:act-latest
Since the local project files are mapped into the /app/ directory, you can just start running the apt commands, editing the files, and whatever is required to ensure that the workflow runs effectively! If the image tag is not available, use docker images to check the image tag available on your machine (the default is act-latest for a medium-sized image).
Check out act’s comprehensive documentation for more configuration details.
Getting SSH access using tmate
While most CI services, such as CircleCI or TravisCI, have a featured debugging mode that lets your SSH inside a running instance (either a VM or a container), GitHub Actions has no such feature (yet!). To SSH inside a running action, you might find tmate GitHub Action useful for your use case.
This GitHub Action allows you to access the running GitHub Actions runner. As soon as the Action reaches this step, an SSH server is invoked, and the connection information is printed to the output of the Checks tab every 5 seconds. You can either open a web terminal for your use case or use SSH to authenticate and debug your workflows straight from your terminal.
To get started, add this step inside your workflow job:
- name: Setup tmate session
   uses: mxschmitt/action-tmate@v3
After the workflow is triggered, you will now notice that a tmate session is available for your GitHub Action runner:
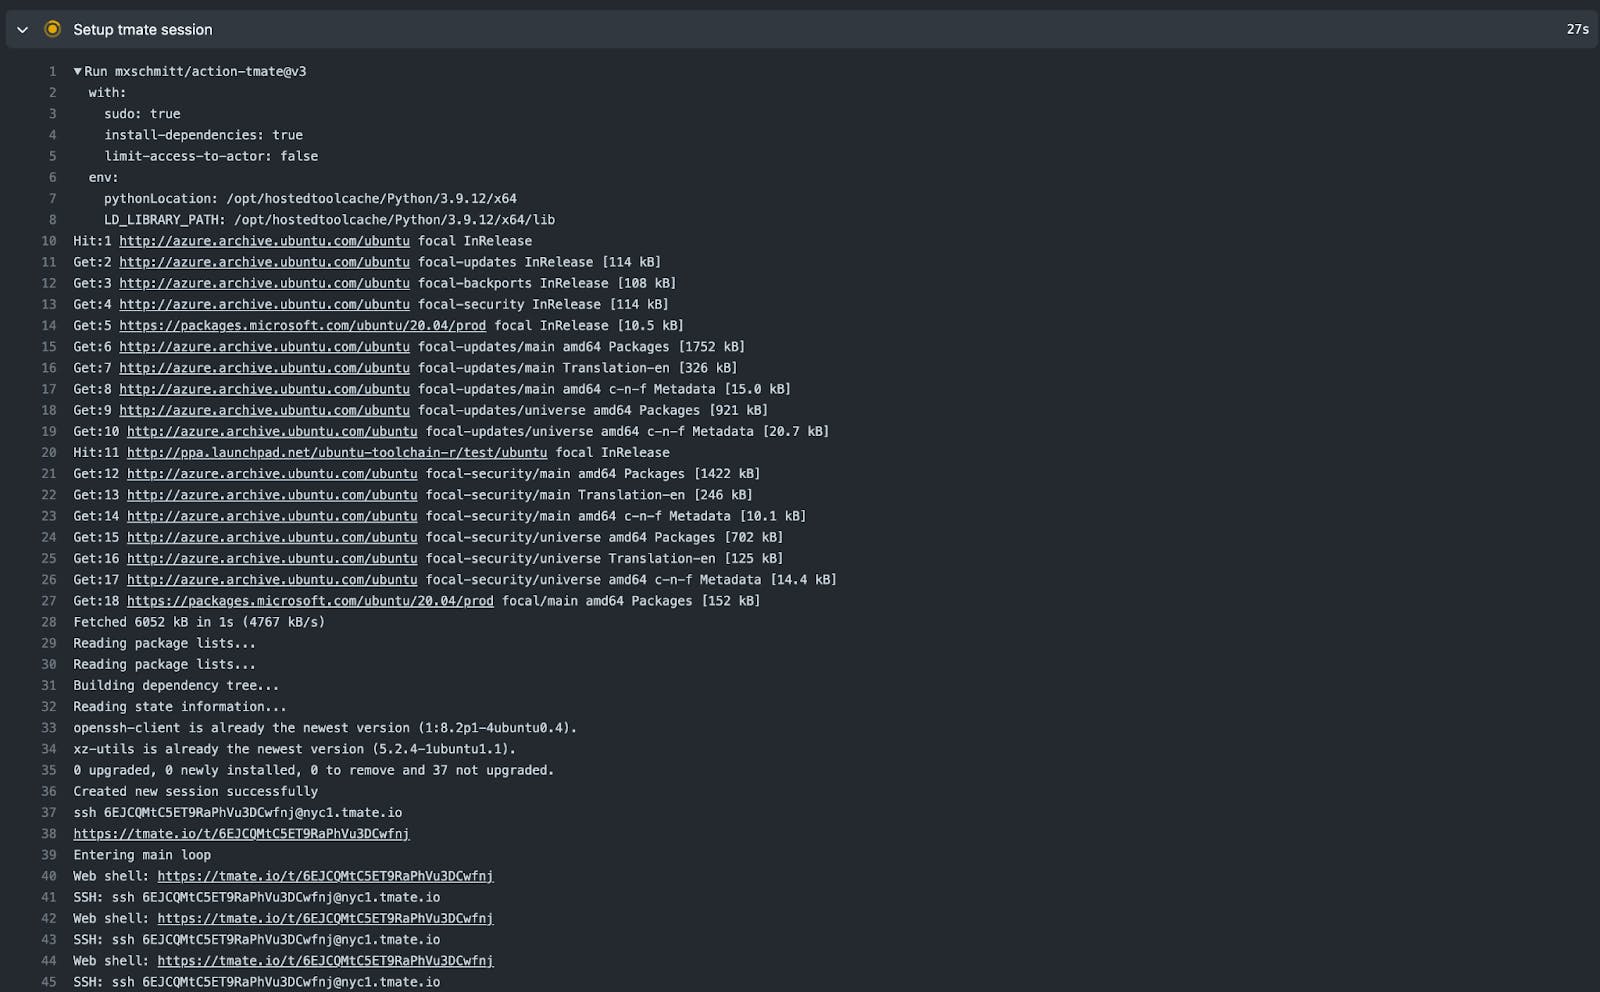
You can just open your terminal (I use Warp) and enter:
ssh 6EJCQMtC5ET9RaPhVu3DCwfnj@nyc1.tmate.io
But how does tmate work? tmate is a terminal multiplexer with instant terminal sharing where you can share your terminal access via SSH to multiple users. You can share the above Web shell link and SSH access with various users who would like to debug the failing workflow together.
To make the best use of it, it is recommended to use it with an if-condition of ${{ failure() }} to ensure that tmate is invoked only when any of the above step fails. It ensures that you don't invoke tmate when it's not required. It is also recommended to add timeout-minutes to reduce the usage of the GitHub Action runner and not let it take the whole duration before the runner times out.
To ensure that you are the only one able to get SSH access (in case it's a public project), use the public SSH keys you have registered with GitHub to authenticate with the runner. To do that, add:
with:
    limit-access-to-actor: true
This also ensures that someone doesn’t access your GITHUB_TOKEN while the workflow is running, and you can safely debug your failing workflows.
If you are not a huge fan of tmate, you can optionally use the Debug via SSH action, which uses Ngrok. However, remember to remove the debug step when the issue has been resolved, and your CI status is green!
Debugging your workflows using Foresight
One of the new tools that I have come across, which is beneficial for debugging and analyzing your GitHub Actions workflow, is Thundra’s Foresight. Foresight provides monitoring/debugging capabilities for GitHub Actions workflows and supports tests across Java, JavaScript (Jest), and Python (PyTest). While Thundra is not suited for use-cases like the above two, it allows a large-scale organization to critically analyze their failing test suite and reduce CI costs and build times considerably.
To get started, we need to create an account on Thundra and select Foresight as the product that we wish to use. We can now go ahead and create a new project. Through the project setting, get the Thundra API Key and the Thundra Project ID, which would be required to configure Foresight in our workflow. Add the following step as part of your workflow job:
- name: Install Thundra Python Agent
  uses: thundra-io/thundra-foresight-python-action@v1
  with:
    apikey: ${{ secrets.THUNDRA_APIKEY }}
    project_id: ${{ secrets.THUNDRA_PROJECT_ID }}
    command: pytest
You can also run the pytest command separately. You can now check out the latest test run details on the corresponding widget. Foresight can show you the overall test run time and help you find flaky and skipped or quite slow tests.
Through Foresight, you can check out more CI observability data like the performance metrics for the test suite, how often they fail, logs of the action, and help you trace bugs by creating a “snapshot” and figure out why particular tests have failed. Compared to act which enables a local run, Foresight provides replay capabilities to help you point the failing tests, thus ensuring a time travel debugging.
Conclusion
In this blog, we have uncovered many ways through which you can debug, emulate and analyze your GitHub Actions workflows to ensure that they work properly. No more continuous commits with random fixes to ensure that your CI is green and deployment successful! GitHub Actions also has more added features that allow you to test your deployment across multiple scenarios, architectures, and environments, making it a tool of collaboration for reliable testing and deployment rather than just a simple CI/CD tooling.
Thanks for reading! Check out the Pyjamas 2021 repository, which hosts the source code for the Flask App and the GitHub Actions workflow, which I presented during Pyjamas Conference 2021.